credit scoring


Imagine nearly $1 trillion in invoices go unpaid annually. For businesses of all sizes, that's not just a number—it's a crisis. Late payments and unpaid invoices create a domino effect, stalling cash flow and putting growth ambitions on hold.
What if it were possible to predict and avoid these issues before they get out of hand? You can do it by monitoring the proper accounts receivable Key performance indicators (KPIs). These metrics highlight the hidden gaps that are costing you money and time, in addition to measuring your success.
Maintaining control over AR data is essential for financial clarity, regardless of the size of your company. Let's explore the key performance indicators(KPIs) that can revolutionize your accounts receivable process and strengthen your bottom line.
KPIs for accounts receivable are quantifiable indicators that help businesses evaluate the effectiveness and efficiency of their AR procedure. They provide valuable data about client payment patterns, operational performance, and cash flow. By monitoring these KPIs, companies can find bottlenecks, lower risks, and improve collections.
To make these metrics actionable, align them with your company's financial goals and industry benchmarks. Let's look into the KPIs businesses with the best results rely on.
Key performance indicators (KPIs) offer the road map for determining how well your AR system functions. By monitoring these metrics, you can identify bottlenecks, improve cash flow, and make smarter financial decisions. Here are the most important KPIs to monitor:
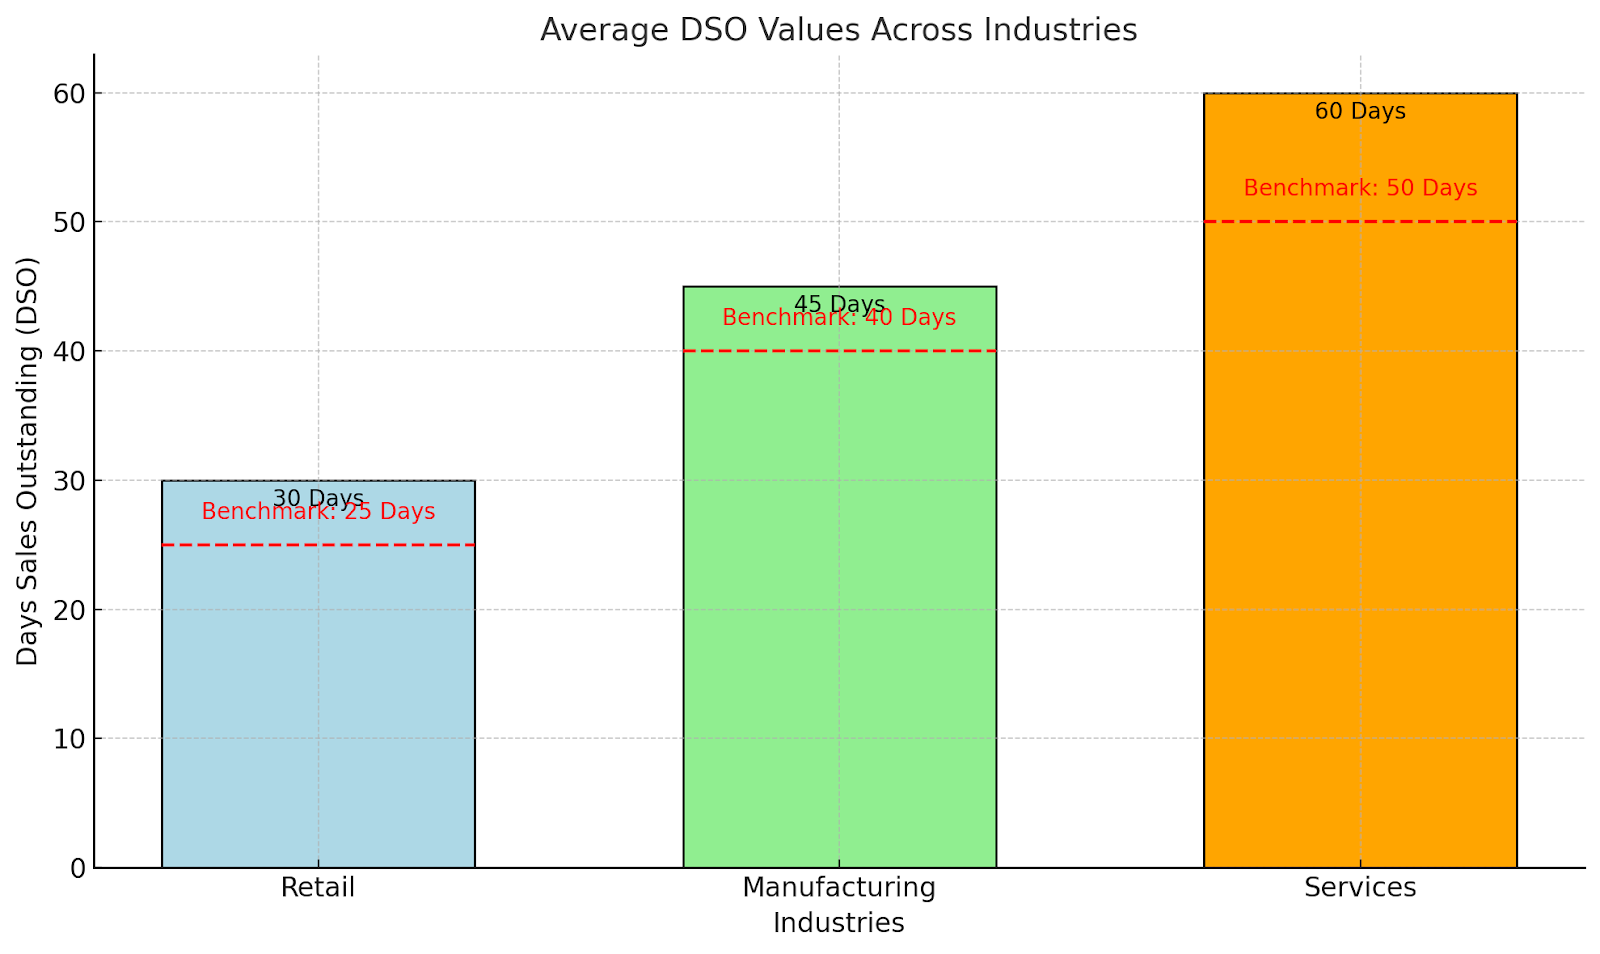
DSO calculates how long it typically takes for a business to get paid following a transaction. It is calculated by multiplying the number of days by the number of days and dividing accounts receivable by total credit sales. For instance, if your DSO is 45 days, you typically receive payment in 45 days. A lower DSO indicates healthier cash flow.
Pro tip: To lower your DSO, automate invoice reminders and provide early payment discounts.
DSO provides a quick overview of payment schedules, but let's move on to the accounts receivable turnover ratio, another crucial indicator of collection effectiveness.

This ratio shows how well your business collects past-due invoices. It's calculated by dividing net credit sales by average accounts receivable.While a low turnover ratio indicates problems, a high ratio indicates that your collections are effective.
For instance, a retail chain with a high ratio may collect payments faster than a B2B service provider.
Pro tip: To increase this ratio, regularly follow up on past-due accounts and use structured payment periods.
After learning about efficiency, let's focus on the average collection period to see how long it takes for customers to make payments.
The average collection period measures the time customers take to pay their invoices. It's closely related to DSO but emphasizes the customer's perspective. For instance, it's time to review your credit practices if your business has a 60-day collection period compared to the industry standard of 45 days.
Pro tip: Prioritize high-risk accounts and divide your customer base based on payment patterns using an aging report.
Let's talk about past-due bills, one of the main issues with AR, and how to monitor them properly.

Tracking overdue invoices as a percentage of total invoices helps you identify problematic trends. A high percentage often indicates unsatisfied customers or weak collection processes.
For Example: By implementing automated payment reminders, South East Client Services (SECS), a leading AR management company, helped a client significantly reduce the volume of past-due invoices, improving their overall cash flow efficiency in just a few months.
Pro tip: Predict and stop past-due payments with data analytics.
To assess the financial effect of uncollectible accounts, we go from past-due bills to another crucial metric: the bad debt ratio.
The bad debt ratio measures the portion of receivables that remain uncollected and must be written off. You can calculate bad debts by dividing them by total credit sales. Poor credit checks or inefficient collection procedures may be indicated by a bad debt ratio greater than 5%.
Pro tip: To reduce bad debts and build a more reliable credit approval process, work with AR experts like SECS.
Let's move from bad debts to the Collection Effectiveness Index, which measures overall success in collections.

CEI evaluates how successfully your business collects receivables over a specified period. It's an extensive metric that accounts for both on-time and past-due payments. For example, a CEI of 80% means you’re efficiently recovering 80% of receivables.
Pro tip: You can significantly increase your CEI by using collection software, such as that provided by SECS.
CEI has given us an overview, so it's time to examine specific insights using invoice aging analysis.

Invoice aging analysis categorizes receivables based on how long they've been outstanding (e.g., 30, 60, or 90+ days). For instance, if a business finds that most past-due invoices fall into the 60+ day category, it may impose more stringent follow-up procedures for that group.
Pro tip: To avoid payment delays, apply predictive analytics and periodically monitor your aging records.
Let's now talk about how to optimize the operating cost of collections.
This metric tracks the total cost of your collections process, including labor, tools, and external agencies. Reducing the cost of collections doesn't mean cutting corners. For instance, SECS uses innovative technology to assist businesses in streamlining their processes, ensuring optimum productivity at the lowest possible cost.
Pro tip: To cut down on collecting expenses and focus on high-value operations, automate repetitive processes.
Finally, let's explore how analyzing customer payment patterns can yield helpful information.

You can see patterns by observing payment habits, such as clients who routinely miss or prefer specific payment options.
For Example: You may observe that a particular client makes late but complete payments. Offering flexible payment terms could improve their timeliness.
Pro tip: Customize payment schemes by analyzing consumer behavior with AI-driven solutions.
Understanding customer payment patterns helps you address existing inefficiencies and builds stronger relationships by offering solutions tailored to their needs, ultimately improving your overall cash flow.
Not all KPIs are equally crucial for all types of businesses. A thorough grasp of your industry, business operations, and overall financial objectives is necessary to choose the best accounts receivable KPIs. Specific indicators may be more important for monitoring effectiveness, while others may be necessary for risk management or enhancing client interactions.
Pay attention to KPIs that directly address your main problems. Do past-due invoices continue to be an issue? The bad debt ratio and the percentage of past-due bills should be on your list. Are you trying to increase cash flow? Your primary KPIs will be Days Sales Outstanding (DSO) and average collection period.
Pro tip: To ensure your selected KPIs meet your particular needs and provide valuable insights, collaborate with AR experts like South East Client Services (SECS).
The next step after determining the right KPIs is to locate the appropriate tools for efficient tracking and analysis. Let's look into how technology can make this procedure easier.
Modern technologies make managing accounts receivable KPIs simpler and more effective than ever. In addition to tracking important indicators, automated technologies give businesses real-time insights to predict and proactively handle challenges. Below are some of the top tools and technologies to consider:
General AR Management Platforms:
South East Client Services' (SECS) Customized Solutions:
AR tools that are specifically tailored to meet your business's needs. Advanced features such as
Pro Tip: To save time, reduce errors, and boost productivity, use solutions that provide automation and predictive analytics.
Using these tools to track, evaluate, and optimize your accounts receivable KPIs, you may take your financial plan to the next level.
Tracking the proper accounts receivable KPIs is essential for maintaining healthy cash flow, optimizing collections, and making informed financial decisions. Metrics such as Days Sales Outstanding, invoice aging analysis, and customer payment trends provide actionable insights that can revolutionize your AR process.
By concentrating on these KPIs and utilizing the right technologies, you may reduce risks, increase productivity, and enhance your bottom line.
South East Client Services (SECS) specializes in helping businesses streamline their accounts receivable management with customized solutions and expert guidance. SECS offers the tools and expertise you need to be successful, whether your goal is to secure data compliance, reduce past-due invoices, or use predictive analytics.
Are you prepared to take charge of your AR? Partner with SECS today and unlock the full potential of your cash flow management!

